What happens when you watch all the UK news channels at once?
For the last six weeks or so, I’ve been running a side project called Broadcast Prism.
The idea is fairly simple:
Record UK television news, transcribe it, work out which stories each channel is covering, then compare how they report the same events.
In practice, it has turned into a slightly ridiculous homelab project involving TV tuners, Whisper, LLMs, databases, evidence extraction and a fairly substantial analysis pipeline.
But the interesting part isn’t really the technology any more.
It’s the data.
Broadcast Prism currently monitors eight UK free-to-air channels, including the BBC, ITV, Channel 4, Channel 5, Sky News and GB News.
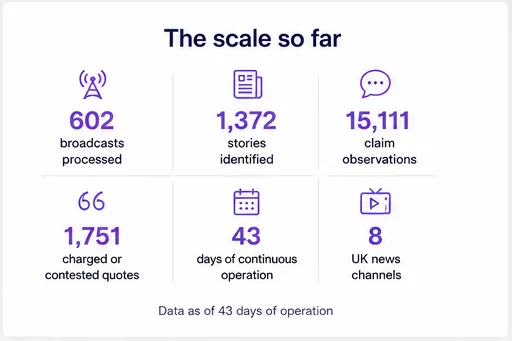
So far, it has processed:
- 602 news broadcasts
- 1,372 stories
- 15,111 individual claim observations
- 1,751 examples of charged or contested language
The site groups coverage of the same event into a single story, then shows how each broadcaster approached it: what they emphasised, the claims they made, important quotes and where their coverage differed.
You can also search across UK news broadcasts by keyword, which has become one of my favourite features.
Instead of wondering whether something was actually discussed on television, or trying to track down the right bulletin on iPlayer or YouTube, I can search the archive and see where and when it appeared.
There are also comparisons of factual claims, contested language, screenshots from broadcasts, story timelines and links between TV coverage and thousands of online news articles. The full story archive is browsable on the site.
And after 43 days, some interesting patterns are starting to appear.
Most stories aren’t shared stories
This was probably the result that surprised me most.
59% of the stories Prism identified were only observed on one channel.
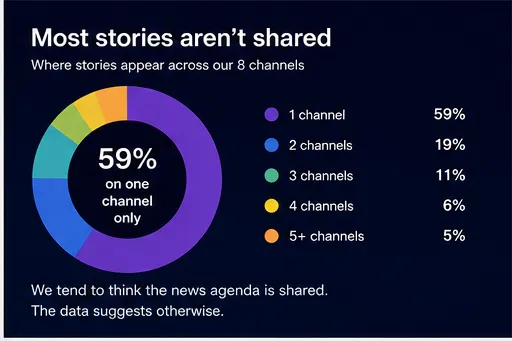
We tend to think of “the news” as a fairly consistent set of events, with each broadcaster presenting them a little differently.
The data suggests something messier.
There is a core set of stories that nearly everyone covers. But around that is a much larger collection of stories selected by individual newsrooms.
Some of this is regional coverage, and the dataset is not yet complete enough to treat the exact percentage as definitive. But the overall pattern is striking.
The shared national news agenda may be considerably smaller than it feels when you only watch one or two broadcasters.
Some channels live in very different news worlds
GB News currently stands out.
More than half of the stories observed on GB News were not matched to coverage from another monitored channel.
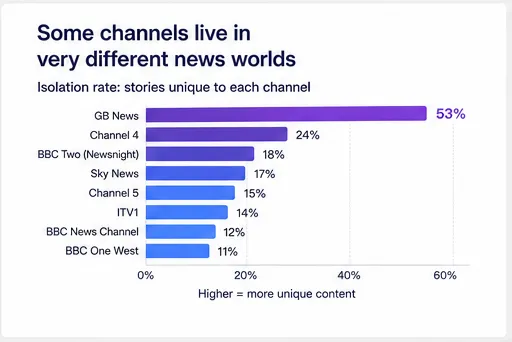
Pairwise comparisons show the same pattern. GB News overlaps much less with the other broadcasters than combinations such as BBC and ITV.
That is interesting because it measures something slightly different from the usual discussion about media bias.
Prism is not trying to decide whether a broadcaster is left-wing, right-wing, good or bad.
It is asking a simpler question:
What does this newsroom decide is news?
With enough data, it should become possible to measure the editorial distance between broadcasters based purely on the stories they choose to cover. You can see the current channel-by-channel comparison on the site.
The same event can become a very different story
Prism gets particularly interesting when multiple channels do cover the same event.
Immigration has produced some of the clearest examples so far.
In one story involving the Spanish border at Ceuta, BBC coverage focused heavily on the human situation and the scale of the event. Sky carried detailed reporting and interviews with migrants. ITV used population comparisons to communicate scale.
GB News framed the same event much more explicitly as a warning about migration and cultural threat.
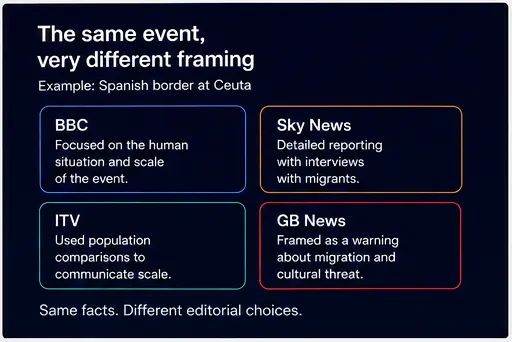
Nobody needs an AI-generated “bias score” to interpret that.
The useful part is putting the coverage next to each other and showing the different editorial choices.
That is increasingly what I want Prism to do: make the differences visible rather than decide what they mean.
News also has velocity
Another metric I’ve started looking at is how quickly stories spread between broadcasters.
Of the multi-channel stories in the current dataset, 87 reached at least three channels on the same day.
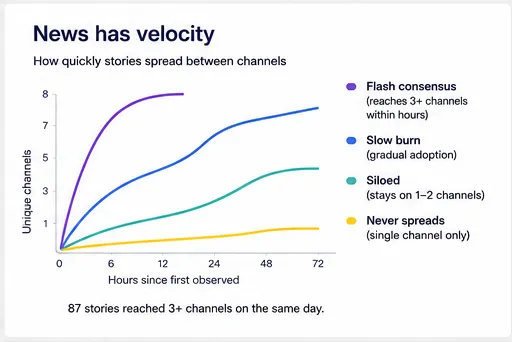
These are the stories that quickly become part of the shared news agenda: major political announcements, significant breaking news, big sporting events and similar stories.
Others move slowly.
And some never escape a single broadcaster.
I’m increasingly interested in modelling this as story velocity: how long it takes an event to move from its first observed coverage to two, three, five or more broadcasters.
With a larger dataset, that could start to show how stories spread through the UK media ecosystem.
Broadcast language differs quite dramatically
Prism also identifies language that appears emotionally charged, opinionated or factually contested.
The early results show considerable differences between channels.
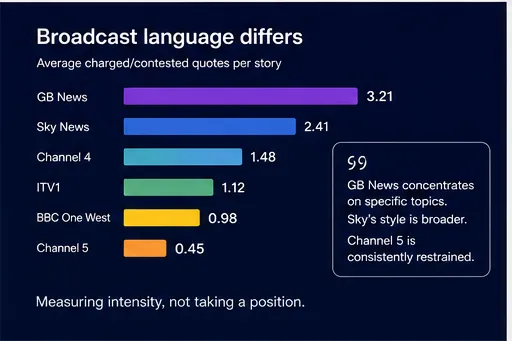
Sky News and GB News currently produce substantially more flagged language per story than BBC, ITV or Channel 5.
But the way that language appears also differs.
On GB News, charged language tends to cluster around subjects such as immigration and political culture-war stories.
On Sky, it appears across a much wider range of subjects, including health, defence, international news and sport. It looks more like a broader house style of dramatic presentation.
Channel 5, meanwhile, has been remarkably restrained by the same measure.
This is also an area where the methodology still needs work. A presenter saying something is different from a guest saying it, and “contested” is not the same thing as “emotionally loaded”.
I’m tightening those distinctions as the dataset grows. The methodology page has more detail on how the language metrics are calculated.
Transcription itself has become an unexpected research problem
Before any of this analysis can happen, the broadcasts need reliable transcripts.
Whisper does a remarkably good job, but names are its Achilles heel.
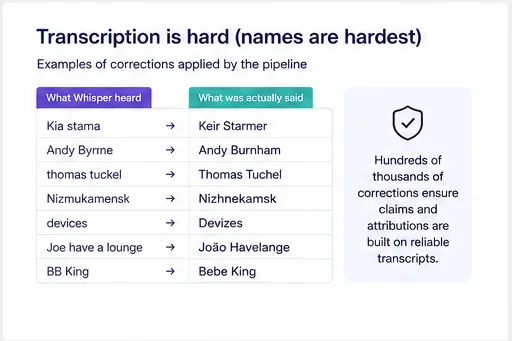
Some examples from the correction pipeline:
Kia stama→ Keir StarmerAndy Byrne→ Andy Burnhamthomas tuckel→ Thomas TuchelNizmukamensk→ Nizhnekamskdevices→ DevizesJoe have a lounge→ João HavelangeBB King→ Bebe King
That last example came from reporting on one of the children murdered in the Southport attack, which shows why these are not just cosmetic spelling mistakes.
If the transcript gets an identity wrong, downstream systems can get the attribution, claim or even the story wrong.
The correction system has now applied hundreds of thousands of fixes, overwhelmingly involving proper nouns.
It has been a useful reminder that building an LLM analysis system is not simply a matter of feeding a transcript into a model. Everything downstream depends on the quality of the evidence underneath it.
Where this is going
Broadcast Prism is still an experiment.
The capture system is not yet as reliable or complete as I want it to be. The analysis prompts and entity correction still need refinement. Some metrics need much more data before I would draw strong conclusions from them.
That is also part of the point.
Rather than treating AI-generated analysis as automatically authoritative, I want the methodology to improve alongside the dataset, with its limitations kept visible.
There are already plenty of questions I want to explore:
Which broadcasters consistently discover stories first?
Which channels tend to follow one another?
Does online news lead television, or vice versa?
Which subjects produce the biggest differences in framing?
How long does a typical story remain news?
Do those patterns change around elections, major international events or quieter news periods?
And perhaps the most interesting question:
When something happens, who decides that it is news in the first place?
Forty-three days is not enough to answer those questions properly.
But it is enough to suggest that the answers might be interesting.
More findings to come as the archive grows, and as I continue improving its accuracy, reliability and methodology. You can explore the full archive at broadcastprism.com, or read more about how it works.